
Article
When Steady Sales Hide Shifting Customer Intent
Inventory velocity can stay flat while your best customers quietly substitute, compromise, and leave. A sale is not always proof of demand.
- Published
- June 25, 2026
- Updated
- August 19, 2026
- Reading time
- 10 min

The Global Signal
Retail's out-of-stock problem is larger, and stranger, than most inventory dashboards suggest. IHL Group, an independent retail and hospitality technology research firm, published an analysis estimating that retailers lose over $634 billion annually to out-of-stock situations worldwide, a figure widely cited across retail trade press including Chain Store Age. The number is not driven by empty shelves alone. IHL's breakdown attributes roughly $238 billion of that loss to genuinely empty shelves, but separately identifies large losses tied to customers who could not find sales help and merchandise that staff could not locate even though it was technically in the store.
That second category is the more interesting one for this argument. A product can be present in a store's inventory system, counted, in stock, and still functionally unavailable to the customer standing in front of an empty peg or an unhelpful search. From the register's point of view, nothing happened: no sale, no signal, no line item. From the customer's point of view, something happened that will shape whether they come back.
Estimated annual retail losses tied to out-of-stock situations
A large visible cost signal, but not a complete view of the customer intent that disappeared before or after the register.
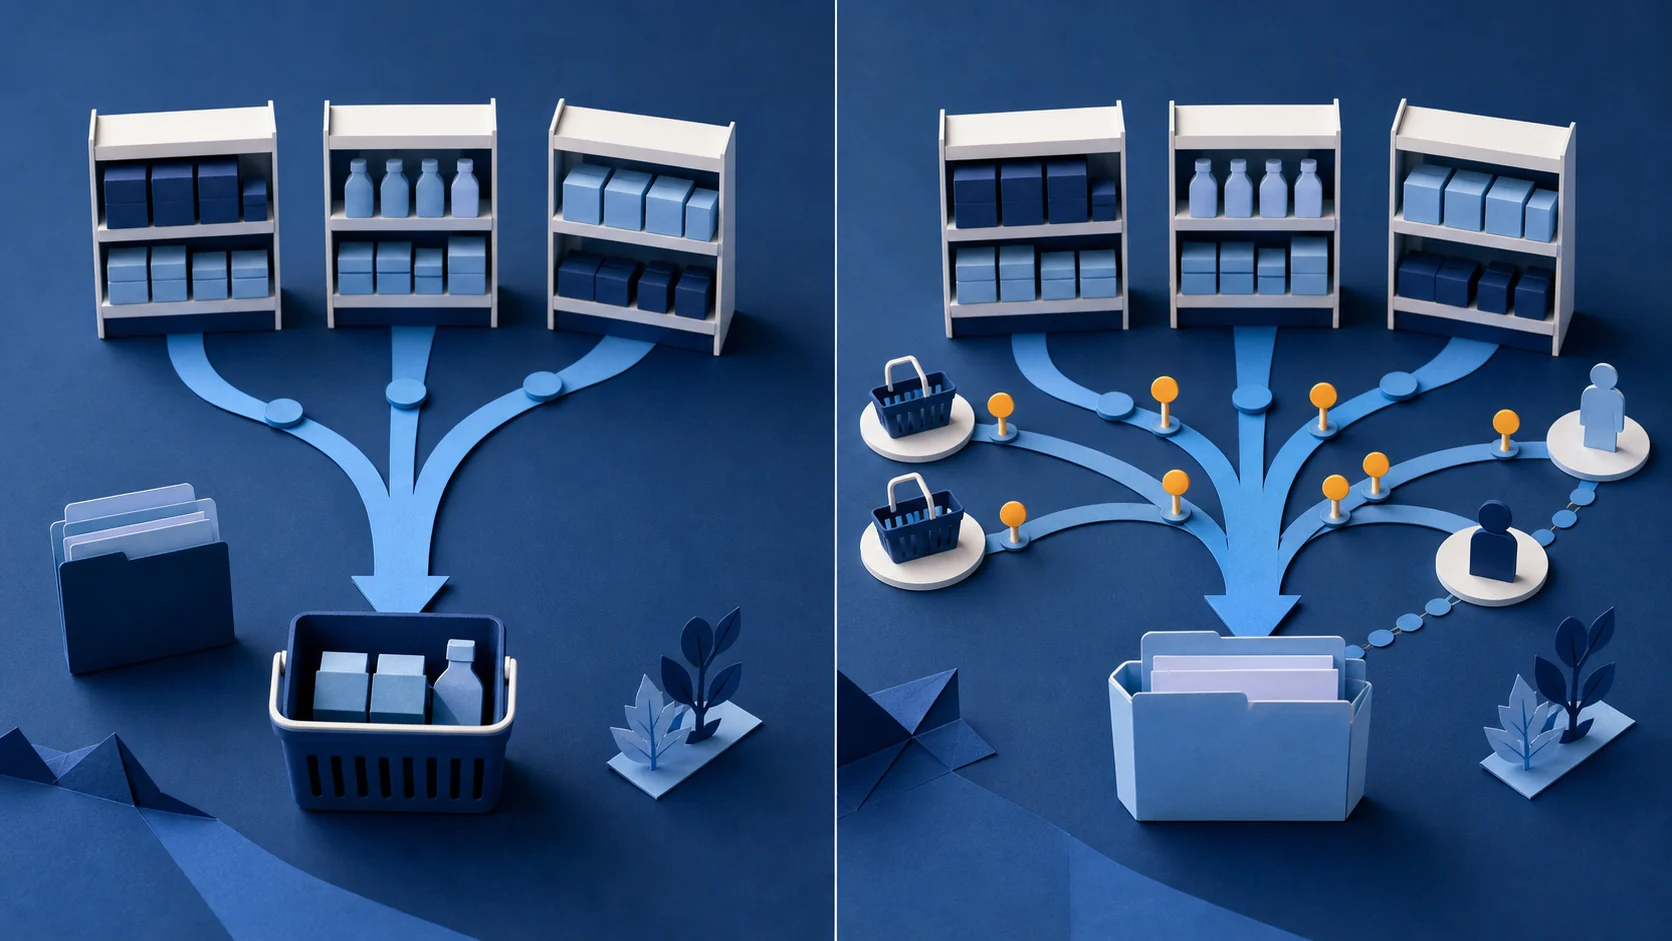
What changes when intent is measured
Velocity shows what moved. Intent shows what the customer came for.
The useful signal appears when sales, substitution, returns, and visit frequency are read together instead of treating the sale as the full answer.
Why the Visible Metric Misleads
If a category moves steadily, the intuitive conclusion is that customers want what is on the shelf. That logic holds until substitution enters the picture. A customer who came in for one product and left with another because the first was unavailable generates a sale in both categories: a data point in the product they left and a data point in the product they took instead. Both look like demand. Neither necessarily is.
The more useful signals sit beside the sales number rather than inside it: whether visit frequency to a category is declining while its raw velocity holds flat, whether a stocked-out item generates a lasting lift in a substitute that never fades once the original is back, and whether returns cluster around items that were bought as a second choice rather than a first one. None of these show up in a standard inventory report, because inventory systems were built to answer whether something moved, not why it moved or whether the customer would have preferred something else entirely.
A sale can be a compromise wearing the costume of demand.
The Leadership Move
The right move is not to distrust sales data. It is to pair velocity with a second layer of signal, drawn from search behavior, substitution patterns, and return rates, so that a category which looks stable on paper can still be checked for whether its best customers are still finding what they came for.
- Ownership
This signal lives between teams by design. Merchandising decides assortment, inventory teams decide stock levels, store operations manage the shelf, and customer insight teams see the churn on the other end. No single one of them owns the full picture, which is exactly why it tends to go unwatched.
- Tradeoff
Depth of assortment for a loyal customer competes directly with breadth of assortment for maximum volume, and margin per unit competes with turns per unit. Neither answer is automatically correct. The failure is not choosing one side of the tradeoff; it is not knowing the tradeoff exists.
- Human consequence
The customer does not experience this as an inventory problem. She experiences it as the simple, quiet realization that a store no longer reliably has what she came for, and she makes that judgment long before she ever files a complaint, if she files one at all.
Implication for Operators
Retailers that separate velocity from intent gain something a stable sales number cannot show them: an early warning that their most loyal customers are drifting toward substitution, well before it shows up as a category-wide decline. The practical shift is treating restocking as a preference decision, not a volume decision, and being honest that a flat sales line can still be hiding a customer base that has quietly changed underneath it.
A sale is not always proof of demand; sometimes it is evidence of compromise. Stable sales can be the most comforting way to miss a customer leaving, because the category still performs by the numbers while the actual composition of its customers shifts underneath. This is not a failure of inventory discipline. Velocity was never designed to measure intent, and it still cannot.
The revenue unknown is not in the unit count. It is in the customer composition that the velocity number was never built to see.
Transformidy infographic
What is a Revenue Unknown?
The unresolved value question that becomes visible when evidence is recognized early enough to still change the decision.
- 01
Evidence
A visible event, behaviour, gap, cost, or relationship change.
- 02
Recognition
The interpretation that names what may be changing underneath the evidence.
- 03
Revenue Unknown
The unresolved question about value, risk, demand, trust, cost, or capability.
- 04
Decision window
The period where leaders can still protect value or create a better outcome.
Do you have systematic ways to listen to customers—through surveys, reviews, social listening, or direct feedback—or is customer input reactive?
FAQ
What is the core difference between inventory velocity and customer intent?
Velocity measures what sold. Intent measures what a customer actually wanted, which is not always the same thing once substitution enters the picture. A steady velocity number can coexist with a customer base that is being slowly replaced by less loyal, more price-sensitive buyers.
Why does a sale sometimes fail to prove demand?
When a customer's preferred item is unavailable, they may buy an alternative rather than leave empty-handed. That purchase registers as a sale in the substitute category, but it reflects compromise rather than preference, and it often comes with a higher return rate.
What should retailers measure alongside velocity?
Visit frequency to a category, substitution patterns following stockouts, and return rates by item are all more revealing of true customer intent than the sales figure alone, and all three are typically available in existing retail data systems without new infrastructure.
Who is responsible for catching this signal inside a retail organization?
It spans merchandising, inventory planning, store operations, and customer insight functions, none of which typically owns the full picture alone. That is precisely why it tends to be missed even in well-run retailers.
How large is the underlying problem across the retail industry?
IHL Group's widely cited retail analysis puts total losses from out-of-stock situations at more than $634 billion annually worldwide, split across genuinely empty shelves and situations where merchandise existed but customers or staff could not locate it.
Related intelligence
Article
When Availability Signals Are Not Aligned: The Hidden Inventory-Demand Mismatch
In stock somewhere in the network is not the same as available to this customer, in this format, in time. That gap does not show up in the out-of-stock rate.
Article
Beyond Abandonment: The Validation Moment When Customers Make Final Commitment
Not all cart abandonment is the same behavior. Device friction, first-time-buyer trust gaps, and genuine indecision each need a different recovery tactic.
Article
Work Redesign and Experience Redesign Must Happen Together
A faster-feeling interface attached to an unredesigned back-end process does not create a faster experience. It creates a specific, quiet disappointment.