
Article
More Surveys Bought Fewer Answers
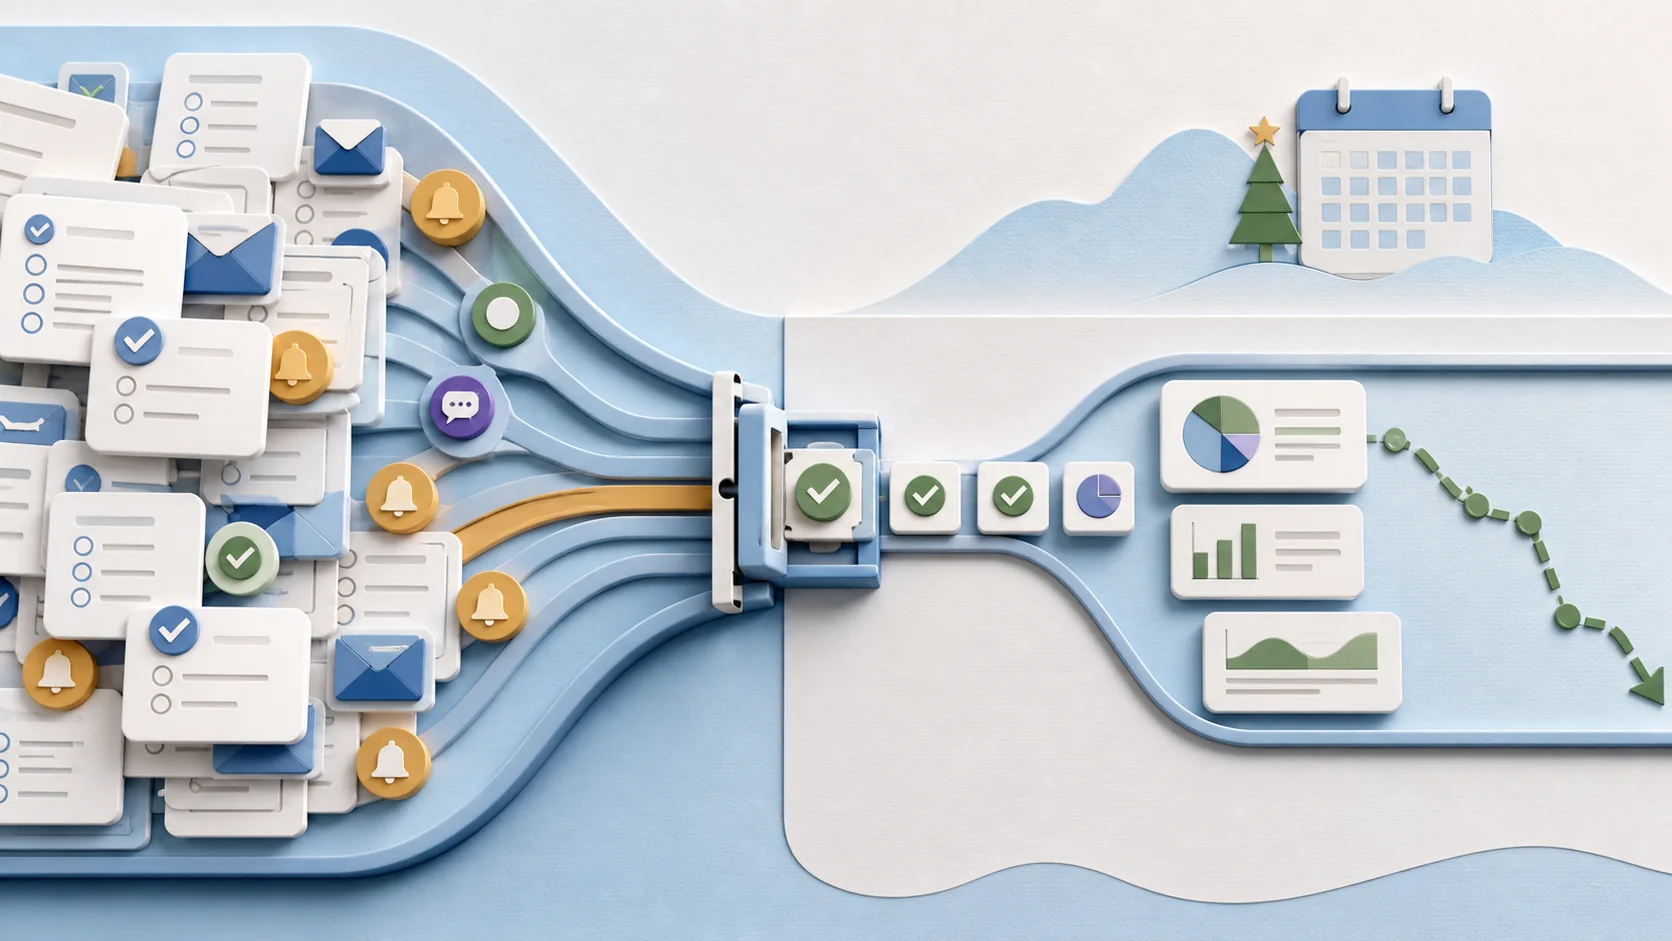
Retently analyzed 25 million survey invitations from 600 ecommerce brands. Response rates fell to 4.03% in Q4, exactly when survey volume nearly doubled. The feedback system was not broken by bad questions. It was broken by asking too often.
- Published
- October 25, 2024
- Updated
- June 18, 2026
- Reading time
- 7 min
2026 updated analysis
What changed since the original article
This page keeps the original Transformidy article as the canonical record and leads with the current interpretation, source notes, and Revenue Unknown framing.
The Quarter Where More Became Less
Retently's analysis of over 25 million survey invitations sent by 600 ecommerce brands in 2025 found response rates of 6.67% in Q1, 7.16% in Q2, and 7.16% in Q3, holding relatively stable across three quarters. In Q4, as brands nearly doubled survey sending volume to capture holiday-season feedback, the response rate dropped to 4.03%, a 44% decline from the prior quarters and below the full-year average of 5.76%.
The detail that makes this finding worth taking seriously, rather than treating as a routine seasonal dip, is the direct relationship between the two changes. Volume went up. Response rate went down. Retently's own analysis names the mechanism directly: despite reaching a much larger audience in Q4, attention became the bottleneck, and additional surveys produced repetition and fatigue rather than new insight.
That is a specific, falsifiable claim, and it runs against the instinct most feedback programs follow. When a business enters its highest-stakes period, the natural response is to ask more customers more often, on the logic that more data reduces uncertainty during the period that matters most. Retently's data shows that logic breaking down in practice: the additional volume did not produce proportionally more answers. It produced a lower rate on a larger base.
Q4 response rate, a 44% drop from the 6.67-7.16% range held in Q1 through Q3
The decline coincided directly with a near-doubling of survey volume for the holiday season.
The Channel a Business Picks Matters More Than It Thinks
Retently's data also breaks response rate down by channel, and the gap is large enough to change how a business should think about volume in the first place. Email surveys averaged a 3.24% response rate. In-app surveys averaged 32.34%, roughly ten times higher. Link-based surveys, typically embedded directly in a receipt or post-purchase flow a customer already opened for another reason, averaged 97.61%.
That spread reframes the Q4 finding. A brand that increased email survey volume during its highest-traffic season was competing for attention inside the most saturated, lowest-response channel available, at precisely the moment that channel was most crowded with other messages. The same volume increase delivered through an in-app or link-based channel, embedded in an interaction the customer was already having, would not face the same attention competition.
By survey type, Retently also found CES (Customer Effort Score) surveys averaging 22.54% response, CSAT averaging 9.76%, and NPS averaging 4.5%, a reminder that the specific question format a business chooses interacts with both channel and timing rather than operating independently of them. A business trying to fix a falling response rate has at least three levers available, channel, timing relative to volume, and question type, and Retently's data suggests channel and timing matter more than most feedback programs currently treat them.
Asking Harder vs. Asking Smarter
One increases volume in the weakest channel. The other increases response by choosing a better one.
Ask-harder approach: increase email survey volume during peak season, competing in a channel averaging 3.24% response, already saturated with other messages. Ask-smarter approach: hold or reduce total volume, but shift a larger share to in-app (32.34%) or link-based (97.61%) channels, where the same customer attention is far more available.

The Leadership Move
The structural choice a CX or customer insights leader faces during a high-volume season is whether to increase survey volume as a default response, or to treat volume as a finite budget against a fixed pool of customer attention.
- Ownership
CX and customer insights leadership own the decision to set a survey-volume ceiling per customer per period, rather than letting individual campaigns or teams add survey touchpoints independently during the business's highest-stakes season.
- Tradeoff
Capping survey volume during Q4 means collecting fewer raw responses at a moment when a business might feel it needs the most feedback. The tradeoff, per Retently's data, is that the alternative, uncapped volume, produced a lower response rate on a larger base, meaning the raw response count gain from higher volume may be smaller than it appears, while customer fatigue compounds into future quarters.
- Human consequence
Customers experiencing survey fatigue are not just failing to respond to one survey; they are forming an impression of the brand as one that asks without listening, since a fourth unanswered request in a season reads differently than a first one. A response rate below 5% during the exact period a business is asking the most means the overwhelming majority of customers who received a request chose not to engage with it at all.
Next Move
If your feedback program increases survey volume during peak periods: Check whether your response rate followed the same inverse pattern Retently found. If it did, the fix is very unlikely to be a better survey question; it is more likely to be a volume or channel decision.
If you rely primarily on email surveys: Test shifting a portion of survey volume to an in-app or post-purchase link-based flow, where Retently's data shows response rates ten to thirty times higher than email, before assuming your customers are simply unwilling to give feedback.
FAQ
How much did survey response rates fall in Retently's study?
Retently analyzed over 25 million survey invitations sent by 600 ecommerce brands during 2025. Response rates held near 7% through Q1 through Q3 (6.67%, 7.16%, 7.16%) before falling to 4.03% in Q4, a 44% decline, against a full-year average of 5.76%.
Why did response rates fall specifically in Q4?
Survey sending volume nearly doubled in Q4 as brands ramped up feedback requests for the holiday season, reaching a larger audience than any prior quarter. Despite that larger audience, the response rate dropped below the full-year average, which Retently attributes to attention saturation: additional surveys during a high-volume period produced repetition and fatigue rather than new insight.
Do different survey channels get different response rates?
Yes, substantially. Retently's data shows email surveys averaging a 3.24% response rate, in-app surveys averaging 32.34% (roughly ten times higher), and link-based surveys averaging 97.61%. Channel choice affects response rate more than most individual survey design decisions.
What should a business do with this finding?
Treat survey volume as a budget to be spent deliberately, not a lever to pull harder during high-stakes periods. Retently's data suggests that increasing volume during a peak period like Q4 holiday shopping produces diminishing and eventually negative returns, since the same audience's attention does not scale with the number of surveys sent to it.
Sources & References
Original article archive
Original article published October 25, 2024: "Fixing Failed Customer Feedback Systems For The Better". Preserved here for provenance, historical context, and citation continuity.
Customer feedback has long been considered the gold standard for brands looking to improve products, services, and customer relationships. It is a process that allows businesses to navigate customer sentiment, satisfaction, and loyalty. Traditionally, customer feedback is gathered through surveys, forms, emails, and focus groups. While these mechanisms have been instrumental in providing insights, a critical problem is emerging—feedback systems are becoming inefficient, overloaded, and at risk of becoming obsolete.
This insight discusses why current customer feedback approaches are failing, especially in a landscape where brands need actionable insights to drive business growth. It explores the typical methods of collecting feedback from B2C and B2B customers, why timing is crucial, the implications of feedback overload, and how brands can revamp these systems with more relevant metrics, new forms of data, and better timing.
Customer Feedback: How It’s Typically Collected in B2C and B2B
For B2C (business-to-consumer) companies, customer feedback is gathered through simple touchpoints such as email surveys, mobile application engagement, star ratings, net promoter scores (NPS), verbal discussions, and post-purchase questionnaires. Companies like Amazon and Uber rely heavily on these metrics to assess customer satisfaction on a large scale. However, for B2B (business-to-business) interactions, customer feedback is more intricate and personalized, often involving in-depth interviews, long-form surveys, and ongoing relationship-based feedback mechanisms.
While both sectors aim to understand their customers' experiences and preferences, B2B customers typically expect a more tailored feedback process that accounts for the complexity of their relationships with brands. B2C customers, on the other hand, often face a one-size-fits-all feedback approach, which can lead to low participation rates or disengaged responses.
The Importance of Timing in Feedback Collection
Timing is crucial in gathering actionable customer feedback. According to a study by Aberdeen Group, real-time feedback collection has a higher response rate of 33% than delayed surveys. Whether it’s immediate feedback after an online purchase or an in-person experience, brands that capitalize on moments when customers are still engaged can capture more accurate sentiments.
In contrast, delayed customer feedback for quick-use products and services (e.g., fast food delivery)—collected days, weeks, or even months after an experience—often results in vague or inaccurate responses. The emotional connection fades, and customers may not remember the nuances of their experiences, leading to data that lacks precision. Additionally, brands with products or services (e.g., changing winter tires at a dealership) that require more time to experience should not activate the customer feedback process too early.
Feedback Overload: The Risk of Diminishing Returns
Companies today are bombarding their customers with feedback requests. Whether it's rating an app, a product, or customer service interactions, customers are becoming fatigued. A recent survey by InMoment found that 80% of consumers feel they are asked for feedback too frequently. The problem with this overload is that it not only diminishes the feedback quality but also risks alienating the customers, brands are trying to engage.
This feedback overload results in several implications:
- Declining Response Rates: Customers grow tired of being repeatedly asked for feedback, resulting in fewer responses.
- Low-Quality Data: As customers become disengaged, the feedback that brands receive tends to be shallow and less insightful.
- Negative Brand Perception: Customers might begin to associate a brand with constant requests for feedback, overshadowing the actual service or product quality.
Companies Leading the Feedback Revolution
Companies like Google, Adobe, and Medallia are leading efforts to rethink feedback systems. Adobe, for example, leverages artificial intelligence to analyze open-ended feedback, enabling deeper insights into customer sentiment beyond basic satisfaction scores. Google’s real-time feedback systems are integrated into their apps and platforms, capturing data when customers are most engaged.
Moreover, innovative startups like Qualtrics push boundaries by combining customer feedback with operational data, offering a holistic view of the customer journey. These companies recognize the need to move beyond traditional feedback mechanisms and invest in tools that capture authentic, actionable insights in real time.
Revamping Feedback: The Power of Behavioral Data and Sentiment Analysis
To avoid customer feedback overload, brands should move beyond surveys and focus on other forms of data. One critical shift is integrating behavioral data and sentiment analysis. Behavioral data can be collected through digital touchpoints, such as website interactions, purchase history, and social media engagement. Tools like Sprinklr offer brands the ability to analyze sentiment based on customers' online conversations and engagements, providing real-time, actionable insights without relying on surveys.
This type of data provides a richer understanding of customer needs, as it captures how customers feel and behave rather than what they say. When combined with AI-driven sentiment analysis, it becomes a powerful tool for identifying trends, patterns, and areas for improvement, often more accurately than traditional feedback mechanisms.
Building Trust Through Feedback and Action
One of the greatest challenges brands face is not just collecting feedback but acting on it. A report by PWC found that 61% of customers feel brands do not act on the feedback they provide, creating a trust gap. Customers who feel that their feedback is ignored are less likely to engage in future feedback opportunities.
To build trust, brands should be transparent about using customer feedback to make changes. Companies like Starbucks excel in this regard, regularly updating customers on what feedback they’ve received and how they are implementing changes based on it. This feedback-action loop not only improves customer satisfaction but also fosters a sense of loyalty.
Relevant Metrics to Track in the New Feedback Paradigm
Brands must shift their focus from traditional metrics like NPS and CSAT (Customer Satisfaction) to more comprehensive and nuanced KPIs that reflect behavioral and sentiment-driven data. Key metrics include:
- Customer Effort Score (CES): This measures the ease with which a customer can complete an action, such as purchasing or resolving an issue (lower is better).
- Customer Sentiment Score (CSS): Derived from sentiment analysis tools, this score helps track customer feelings toward the brand in real time (higher is better).
- Engagement Rates: A combination of how often customers interact with the brand (e.g., time on site, app engagement, social media interaction)(higher is better).
- Churn Rate: An essential metric to gauge how many customers leave a brand after purchase (lower is better).
When Is The Right Time To Collect Customer Feedback?
Collecting customer feedback at the right time is critical for ensuring the quality and relevance of the insights gathered. The timing can influence the feedback accuracy, customer willingness to respond, and the actionability of the insights.
Here are key moments when feedback collection can be most effective:
1. Post-Purchase or Post-Service
This is one of the most common times to collect feedback. Asking customers to share their experiences immediately after they purchase or receive a product/service ensures that the interaction is fresh in their minds. For B2C businesses, post-purchase feedback can help assess the checkout process, product satisfaction, or delivery experience. For B2B companies, it can provide insights into how well the service met expectations or if the solution delivered value.
Why it works:
- Captures real-time reactions.
- Ensures customers are still engaged with the brand.
Example: Amazon asks for product reviews shortly after delivery, ensuring that customers provide feedback while the experience is still fresh.
2. Mid-Experience (During Use or Interaction)
Sometimes it’s more effective to capture feedback during the experience itself rather than waiting until the end. For instance, in mobile apps or online platforms, brands can ask for feedback at key stages, such as when a customer completes a task or interacts with certain features. This in-context feedback can help refine user experiences by addressing friction points as they arise.
Why it works:
- Provides actionable insights at the moment when a problem or delight is experienced.
- Captures contextual feedback about specific parts of the customer journey.
Example: Spotify regularly prompts users to rate its features while they are using the app, allowing it to make real-time adjustments.
3. At Key Milestones in the Customer Journey
For long-term relationships, such as those in B2B or subscription services, customer feedback collection at critical milestones can help assess satisfaction over time. This can include times such as after onboarding, at the halfway point of a project, or during major changes to the product or service.
Why it works:
- Tracks long-term satisfaction and identifies early signs of dissatisfaction.
- Builds a continuous feedback loop to improve ongoing relationships.
Example: Salesforce asks for feedback after major project milestones to ensure client satisfaction throughout the process.

4. Post-Issue Resolution
Collecting customer feedback after resolving a customer service issue is crucial for evaluating how well the issue was handled and whether the customer’s expectations were met. This timing is important in maintaining or restoring customer trust, as it shows a commitment to improving based on real customer experiences.
Why it works:
- Provides insights into the effectiveness of customer support.
- Offers an opportunity to turn a negative experience into a positive one through responsive actions.
Example: Zendesk sends a survey after customer support interactions, asking customers to rate their satisfaction with the resolution.
5. After Major Product or Service Updates
When companies introduce a new feature, product line, or service offering, it’s important to gauge customer reactions. Feedback gathered immediately after such launches can help brands assess whether the changes are resonating with customers and address any concerns or usability issues.
Why it works:
- Allows brands to make rapid adjustments based on customer input.
- Provides data on how well new offerings are meeting customer needs.
Example: Apple often gathers customer feedback shortly after releasing software updates or new products to ensure that its offerings are delivering the expected quality.
6. After a Drop-off or Cancellation
When a customer cancels a subscription or stops using a service, this moment offers a valuable customer feedback opportunity. While it might feel like a negative time to ask for feedback, the insights gleaned can be crucial for identifying pain points that caused the churn and helping the brand improve retention.
Why it works:
- Helps brands uncover reasons for churn.
- Provides actionable insights to prevent future cancellations.
Example: Netflix sends a survey to customers who cancel their subscriptions, asking them to explain why they left.
7. At Random Intervals
In some cases, gathering feedback at unexpected moments, rather than after every interaction, can capture more authentic and less fatigued responses. Random customer feedback requests spread over time can prevent customers from feeling overwhelmed and can generate more thoughtful input.
Why it works:
- Prevents customer feedback fatigue from constant requests.
- Generates more genuine insights from customers not influenced by their most recent interaction.
Example: Google asks for feedback randomly across its various services (such as Google Maps or Gmail) instead of every time a customer uses them.
8. At the Peak or End of a Memorable Experience
Collecting feedback during a memorable or emotional peak in the customer experience can lead to more enthusiastic and honest responses. This could be during a celebratory event, a major purchase like a new car, or after using a unique service like a luxury vacation. Customers are likely to provide thoughtful and detailed feedback when they feel emotionally engaged.
Why it works:
- Captures emotional insights, which are often more valuable than functional ones.
- Provides deep insights during moments of high satisfaction or even dissatisfaction.
Example: Disney Parks captures feedback from guests during their visit to ensure they understand how guests feel about key attractions and experiences.
9. During Community or Engagement Events
For brands with loyal communities, gathering feedback during engagement activities like webinars, live events, or loyalty program meet-ups can help assess how customers feel about the brand's culture and community-building efforts.
Why it works:
- Measures community sentiment and engagement in real-time.
- Encourages customers to provide feedback while they are engaged and feeling connected to the brand.
Example: Nike often gathers feedback from participants at their community events like Nike Run Club sessions, to understand how the brand's community efforts are resonating with athletes.
10. During Disruptions
Disruption happens! Whether it is a mobile company internet outage, a botched software fix, or a weather-related event, brands can turn a potentially negative event into a positive one by gathering customer feedback while showing support, care, and empathy.
Why it works:
- Measures affected customer sentiments in real-time and over a longer period should the disruption persist.
- Encourages customers to provide feedback proactively while offering updated information and solutions.
Example: Air Canada informed customers weeks in advance of a potential work action that could disrupt their travel plans. The airline communicated with potential customers, offered them options to move their travel plans, and sought feedback afterward.
Transform For The Better
Brands that embrace a revamped feedback strategy receive richer, more actionable insights but will also see tangible business growth. By moving beyond traditional surveys and incorporating real-time, behavioral, and sentiment data, companies can create more personalized and effective customer experiences.
As feedback systems evolve, brands will build greater trust, reduce customer churn, and identify key growth opportunities effectively. The brands that invest in upgrading their feedback strategies today will become the leaders in customer-centric innovation tomorrow.
How Can We Help?
Transformidy is available to help you understand your brand’s value proposition and maximize your customer experience strategy for business growth, engagement, and satisfaction.
Contact us or set up a 30-minute complimentary consultation for more information on our services, insights, or showcases. We look forward to hearing from you.
FAQ
How much did survey response rates fall in Retently's study?
Retently analyzed over 25 million survey invitations sent by 600 ecommerce brands during 2025. Response rates held near 7% through Q1 through Q3 (6.67%, 7.16%, 7.16%) before falling to 4.03% in Q4, a 44% decline, against a full-year average of 5.76%.
Why did response rates fall specifically in Q4?
Survey sending volume nearly doubled in Q4 as brands ramped up feedback requests for the holiday season, reaching a larger audience than any prior quarter. Despite that larger audience, the response rate dropped below the full-year average, which Retently attributes to attention saturation: additional surveys during a high-volume period produced repetition and fatigue rather than new insight.
Do different survey channels get different response rates?
Yes, substantially. Retently's data shows email surveys averaging a 3.24% response rate, in-app surveys averaging 32.34% (roughly ten times higher), and link-based surveys averaging 97.61%. Channel choice affects response rate more than most individual survey design decisions.
What should a business do with this finding?
Treat survey volume as a budget to be spent deliberately, not a lever to pull harder during high-stakes periods. Retently's data suggests that increasing volume during a peak period like Q4 holiday shopping produces diminishing and eventually negative returns, since the same audience's attention does not scale with the number of surveys sent to it.
Related intelligence
Article
Apple Is Reportedly Building a MacBook Designed to Lose the Spec Sheet Comparison
Apple's new MacBook Neo runs an iPhone chip, not a Mac chip, and starts at $699 to $899, roughly $100 to $300 below the MacBook Air. It has no Thunderbolt. Apple built its first laptop specifically to lose a spec sheet comparison, on purpose, to win a price comparison instead.
Article
B2B Customer Experience: Moving Beyond Transactional
B2B customer success evolved beyond account management. Organizations that invest in customer outcomes built strategic partnerships. Those treating success as transaction support lost customers to specialized competitors.
Article
13 Automakers Signed On to CarPlay Ultra. One Shipped It.
Standard CarPlay is in effectively every new car sold in America. CarPlay Ultra, announced with 13 automaker partners, is shipping in exactly one brand a year later. Mercedes, Audi, Volvo, and Renault walked back their commitments. Ford's CEO explained why in one sentence.